Using maths in Geography - April 2022
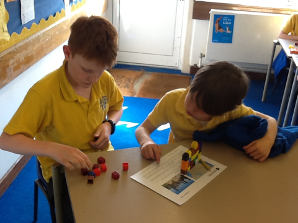
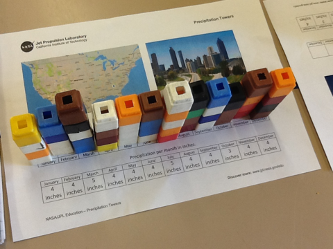
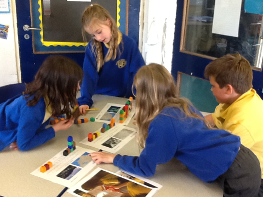
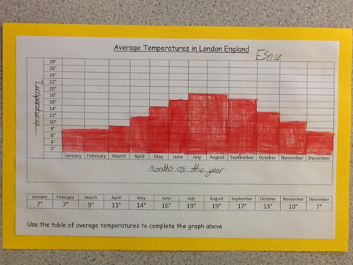
In Geography the children in Class Lowry have been continuing their work on climate zones and reading and presenting climate data. This week their focus was creating precipitation towers using rainfall data for some North American states. The children read rainfall charts and made bar graphs using blocks. They then, compared the data. One group discovered that opposite coasts are quite different with one having very little rainfall and the other having lots. Another group found out that the average rainfall in two states on the same coast were similar but the pattern of how it fell was quite different with one state having dry summers but heavy rainfall in winter and the other having similar rainfall all year round. Once they started the children quickly got very involved asking increasingly complex ideas and researching them by swapping data and using their precipitation towers and maps. Additionally, they have been reading, presenting and interpreting data by reading temperature tables and presenting the data in a bar graph.